This post is one in a series of feature stories on trends that shape advanced energy markets in the U.S. and around the world. It is drawn from Advanced Energy Now 2017 Market Report, which was prepared for AEE by Navigant Research.
In 2016, the solar PV industry set a record with an estimated 77.2 GW of new capacity installed around the world – 52% above 2015’s installation figure of 51 GW.[1] That does not mean the year was an easy one for the industry. Pricing pressure on manufacturers and developers alike kept revenue growth from matching the rate of deployment. Still, the global market grew 35% in 2016, to $131.8 billion.
Solar PV module prices continued their dramatic price drops in 2016 – by as much as 30%. Expansion of PV manufacturing capacity between 2015 and early 2016 caused a slight overcapacity, stimulating price competition between manufacturers. Also, countries around the world changed from Feed-in Tariffs (FiTs) to competitive auctions, which forced developers to cut margins to win deals. These factors led to record deployment – and lower costs for solar power. 2016 marked the lowest Power Purchase Agreement (PPA) price for solar PV, with Dubai Electricity and Water Authority signing a $0.029/kWh PPA in the United Arab Emirates for phase three of the 800 MW Mohammed bin Rashid Al Maktoum Solar Park. The 350 MW project will be built by a consortium led by the Masdar Group and will be commissioned by 2020.
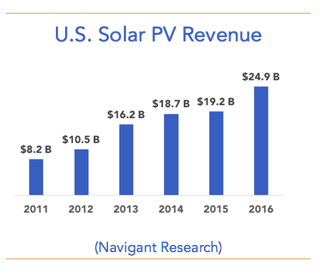 U.S. installations also set an all-time high, with an estimated 14.6 GW of capacity added in 2016 – a 90% increase over 2015. Utility-scale installations accounted for more than two-thirds of the total. The U.S. market surged in anticipation of the scheduled reduction of the federal Investment Tax Credit (ITC) at the end of 2016. Instead, the ITC was extended late in the year through 2019 at the 30% level. Some projects that would have been fast-tracked to catch a vanishing ITC have now been spaced out, carrying the utility-scale boom into 2017 and beyond.
Commercial and residential capacity additions also increased in 2016, but at a slower rate. There were an estimated 2.7 GW of new residential additions and 1.6 GW of commercial installations in the U.S. market in 2016. These two segments have accounted for between 40% and 60% of the total market the last five years, but dropped below 30% in 2016 as utility-scale installations took off. (It is important to note that a significant portion of corporate PPA-driven expansion is off-site and therefore counted under the utility-scale total.) California, North Carolina, Arizona, New Jersey, and Nevada continue to lead the market, but growth in Georgia, Utah, Texas and even South Carolina, among others had strong showings in 2016, contributing to the new record. California, the largest market for residential solar, saw a decline in new additions in 2016 compared to prior years.
Globally, solar PV growth in 2016 was led by China. The country doubled its capacity additions to 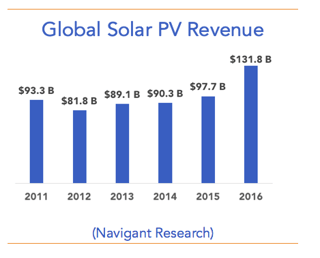 around 30 GW – 22 GW in the first six months of 2016 as developers rushed to benefit from the 2015 FiT. The Japanese market fell an estimated 14% compared to 2015, but still added 8.7 GW, making it the third-largest market worldwide, after the United States.
One of the countries that showed strongest growth was India, which more than tripled new capacity additions from 2 GW in 2015 to over 6 GW in 2016. (The total of 2016 installations was approximately 8 GW near the end of the year, but a number of projects then in the commissioning stage officially came online in 2017.) The country must further increase growth in order to achieve its ambitious target of 100 GW of solar capacity by 2022. The Ministry of New and Renewable Energy is therefore focusing on large utility-scale installations and recently doubled its new generation target for this category from 20 GW to 40 GW by 2020. The target calls for a total of 60 GW of combined “Large- and Medium- Scale” systems to compliment 40 GW of rooftop systems.
Meanwhile, at an estimated 7.1 GW of installations, Europe had its worst year since 2007 – a 17% decline from 2015. Despite the relatively high retail cost of electricity on the continent, the solar industry in Europe is going through a transition period. The industry is expected to further decline in 2017 as incentives expire in the UK, the largest market during the past two years. But not all is gloomy. Italy, which recently adopted net metering, increased solar installations in 2016. In Spain, the government is rethinking the so-called “sun tax” that amounted to a retroactive tax for onsite consumption. If the tax is reversed, it could help to revive development in the country with the best solar resources on the continent.
Learn more about the full size and scope of the U.S. and global advanced energy markets in this year's Advanced Energy Now Market Report, available free at the link below:

[1] Official estimates range from 50-58 GW for 2015 due to different reporting methodologies. For the purpose of this report, Navigant Research used a conservative estimate.